Introducing FastRTC, a new way to build real-time AI apps
Read More
Introducing FastRTC, a new way to build real-time AI apps
Read More %20Copyright%202022%20Fonticons,%20Inc.%20--%3e%3cpath%20d='M172.5%20131.1C228.1%2075.51%20320.5%2075.51%20376.1%20131.1C426.1%20181.1%20433.5%20260.8%20392.4%20318.3L391.3%20319.9C381%20334.2%20361%20337.6%20346.7%20327.3C332.3%20317%20328.9%20297%20339.2%20282.7L340.3%20281.1C363.2%20249%20359.6%20205.1%20331.7%20177.2C300.3%20145.8%20249.2%20145.8%20217.7%20177.2L105.5%20289.5C73.99%20320.1%2073.99%20372%20105.5%20403.5C133.3%20431.4%20177.3%20435%20209.3%20412.1L210.9%20410.1C225.3%20400.7%20245.3%20404%20255.5%20418.4C265.8%20432.8%20262.5%20452.8%20248.1%20463.1L246.5%20464.2C188.1%20505.3%20110.2%20498.7%2060.21%20448.8C3.741%20392.3%203.741%20300.7%2060.21%20244.3L172.5%20131.1zM467.5%20380C411%20436.5%20319.5%20436.5%20263%20380C213%20330%20206.5%20251.2%20247.6%20193.7L248.7%20192.1C258.1%20177.8%20278.1%20174.4%20293.3%20184.7C307.7%20194.1%20311.1%20214.1%20300.8%20229.3L299.7%20230.9C276.8%20262.1%20280.4%20306.9%20308.3%20334.8C339.7%20366.2%20390.8%20366.2%20422.3%20334.8L534.5%20222.5C566%20191%20566%20139.1%20534.5%20108.5C506.7%2080.63%20462.7%2076.99%20430.7%2099.9L429.1%20101C414.7%20111.3%20394.7%20107.1%20384.5%2093.58C374.2%2079.2%20377.5%2059.21%20391.9%2048.94L393.5%2047.82C451%206.731%20529.8%2013.25%20579.8%2063.24C636.3%20119.7%20636.3%20211.3%20579.8%20267.7L467.5%20380z'/%3e%3c/svg%3e)
Data visualization is a crucial aspect of data analysis and machine learning. The Gradio DataFrame component is a popular way to display tabular data within a web application.
But what if you want to stylize the table of data? What if you want to add background colors, partially highlight cells, or change the display precision of numbers? This Guide is for you!
Let's dive in!
Prerequisites: We'll be using the gradio.Blocks class in our examples.
You can read the Guide to Blocks first if you are not already familiar with it. Also please make sure you are using the latest version version of Gradio: pip install --upgrade gradio.
StylerThe Gradio DataFrame component now supports values of the type Styler from the pandas class. This allows us to reuse the rich existing API and documentation of the Styler class instead of inventing a new style format on our own. Here's a complete example of how it looks:
import pandas as pd
import gradio as gr

# Creating a sample dataframe
df = pd.DataFrame({
    "A" : [14, 4, 5, 4, 1],
    "B" : [5, 2, 54, 3, 2],
    "C" : [20, 20, 7, 3, 8],
    "D" : [14, 3, 6, 2, 6],
    "E" : [23, 45, 64, 32, 23]
})

# Applying style to highlight the maximum value in each row
styler = df.style.highlight_max(color = 'lightgreen', axis = 0)

# Displaying the styled dataframe in Gradio
with gr.Blocks() as demo:
    gr.DataFrame(styler)

demo.launch()
The Styler class can be used to apply conditional formatting and styling to dataframes, making them more visually appealing and interpretable. You can highlight certain values, apply gradients, or even use custom CSS to style the DataFrame. The Styler object is applied to a DataFrame and it returns a new object with the relevant styling properties, which can then be previewed directly, or rendered dynamically in a Gradio interface.
To read more about the Styler object, read the official pandas documentation at: https://pandas.pydata.org/docs/user_guide/style.html
Below, we'll explore a few examples:
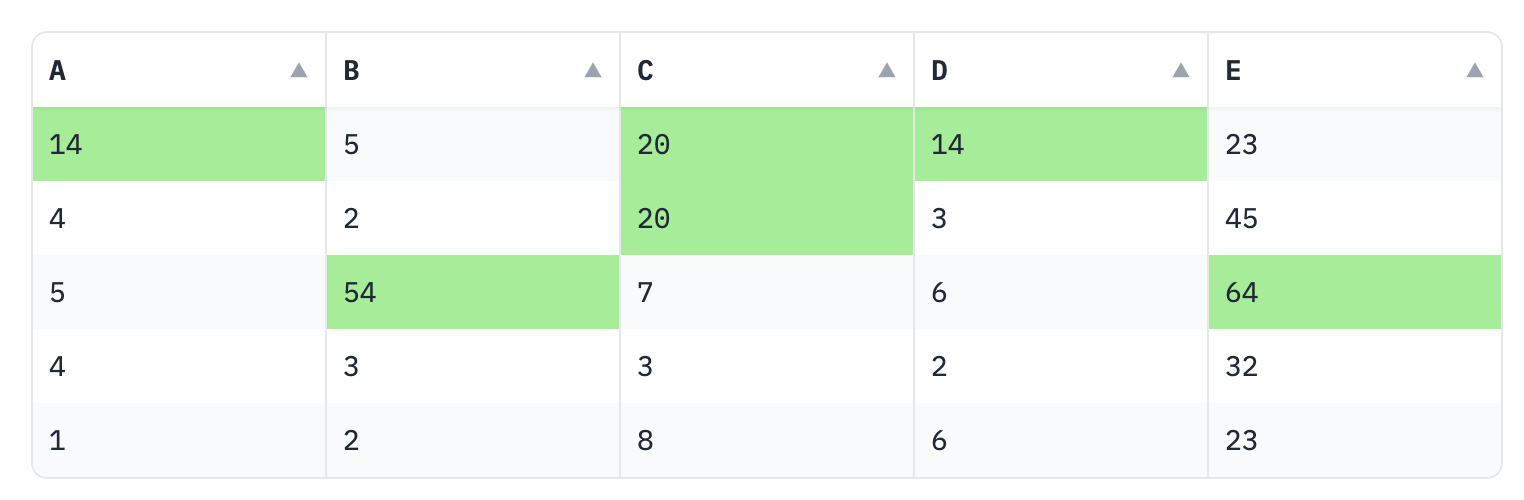
Ok, so let's revisit the previous example. We start by creating a pd.DataFrame object and then highlight the highest value in each row with a light green color:
import pandas as pd

# Creating a sample dataframe
df = pd.DataFrame({
    "A" : [14, 4, 5, 4, 1],
    "B" : [5, 2, 54, 3, 2],
    "C" : [20, 20, 7, 3, 8],
    "D" : [14, 3, 6, 2, 6],
    "E" : [23, 45, 64, 32, 23]
})

# Applying style to highlight the maximum value in each row
styler = df.style.highlight_max(color = 'lightgreen', axis = 0)
Now, we simply pass this object into the Gradio DataFrame and we can visualize our colorful table of data in 4 lines of python:
import gradio as gr

with gr.Blocks() as demo:
    gr.Dataframe(styler)

demo.launch()
Here's how it looks:
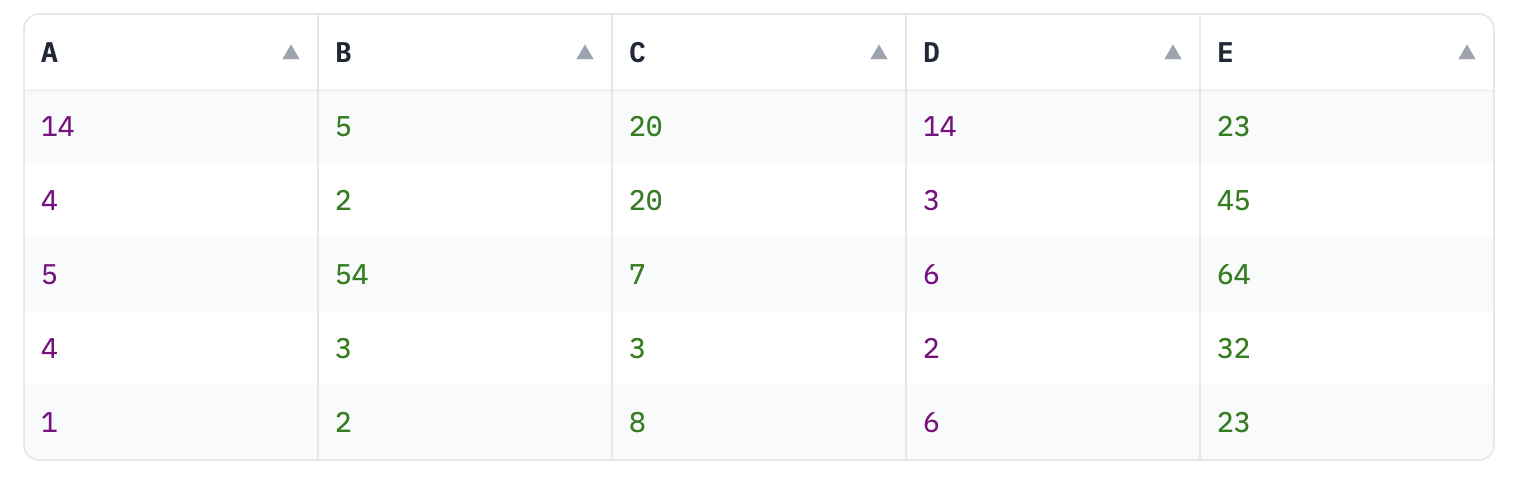
Apart from highlighting cells, you might want to color specific text within the cells. Here's how you can change text colors for certain columns:
import pandas as pd
import gradio as gr

# Creating a sample dataframe
df = pd.DataFrame({
    "A" : [14, 4, 5, 4, 1],
    "B" : [5, 2, 54, 3, 2],
    "C" : [20, 20, 7, 3, 8],
    "D" : [14, 3, 6, 2, 6],
    "E" : [23, 45, 64, 32, 23]
})

# Function to apply text color
def highlight_cols(x):
    df = x.copy()
    df.loc[:, :] = 'color: purple'
    df[['B', 'C', 'E']] = 'color: green'
    return df

# Applying the style function
s = df.style.apply(highlight_cols, axis = None)

# Displaying the styled dataframe in Gradio
with gr.Blocks() as demo:
    gr.DataFrame(s)

demo.launch()
In this script, we define a custom function highlight_cols that changes the text color to purple for all cells, but overrides this for columns B, C, and E with green. Here's how it looks:
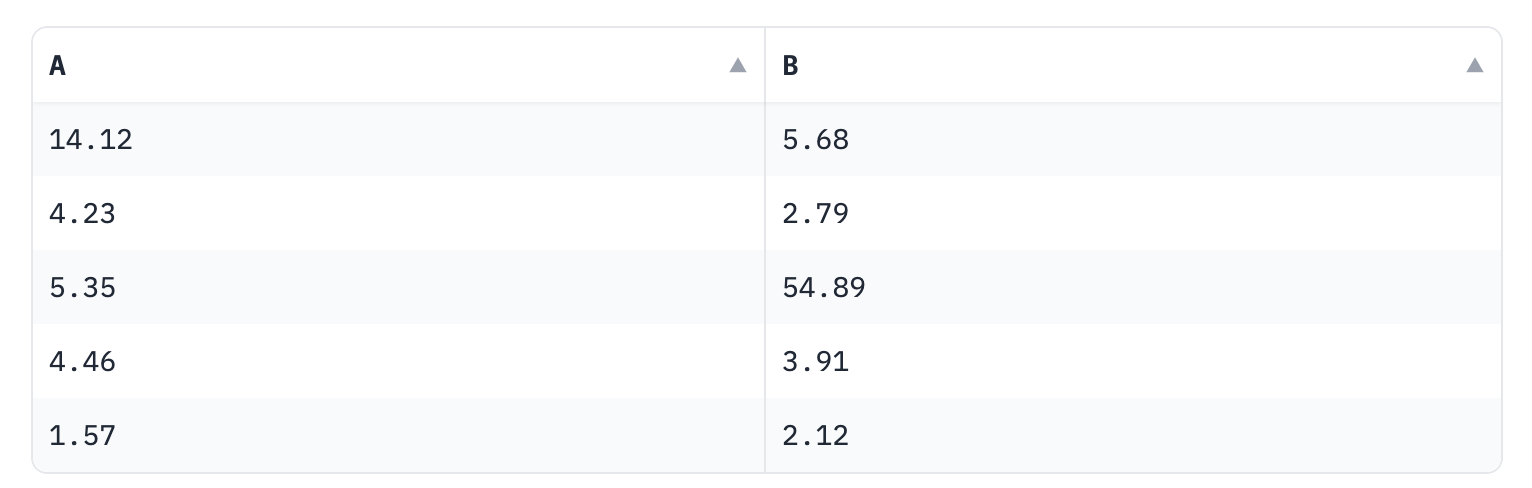
Sometimes, the data you are dealing with might have long floating numbers, and you may want to display only a fixed number of decimals for simplicity. The pandas Styler object allows you to format the precision of numbers displayed. Here's how you can do this:
import pandas as pd
import gradio as gr

# Creating a sample dataframe with floating numbers
df = pd.DataFrame({
    "A" : [14.12345, 4.23456, 5.34567, 4.45678, 1.56789],
    "B" : [5.67891, 2.78912, 54.89123, 3.91234, 2.12345],
    # ... other columns
})

# Setting the precision of numbers to 2 decimal places
s = df.style.format("{:.2f}")

# Displaying the styled dataframe in Gradio
with gr.Blocks() as demo:
    gr.DataFrame(s)

demo.launch()
In this script, the format method of the Styler object is used to set the precision of numbers to two decimal places. Much cleaner now:
So far, we've been restricting ourselves to styling that is supported by the Pandas Styler class. But what if you want to create custom styles like partially highlighting cells based on their values:

This isn't possible with Styler, but you can do this by creating your own styling array, which is a 2D array the same size and shape as your data. Each element in this list should be a CSS style string (e.g. "background-color: green") that applies to the <td> element containing the cell value (or an empty string if no custom CSS should be applied). Similarly, you can create a display_value array which controls the value that is displayed in each cell (which can be different the underlying value which is the one that is used for searching/sorting).
Here's the complete code for how to can use custom styling with gr.Dataframe as in the screenshot above:
import gradio as gr

data = [
    ["DeepSeek Coder", 79.3],
    ["Llama 3.3", 68.9],
    ["Qwen 2.5", 61.9],
    ["Gemma 2", 59.5],
    ["GPT 2", 18.3],
]

headers = ["Model", "% Correct (LeetCode Hard)"]

def get_styling(values):
    return [["", f"background: linear-gradient(90deg, rgba(220, 242, 220) {row[1]}%, transparent {row[1]}%)"] for row in values]

def get_display_value(values):
    display_values = []
    medals = ["🥇", "🥈", "🥉"]
    for i, row in enumerate(values):
        if i < 3:
            display_values.append([f"{medals[i]} {row[0]}", row[1]])
        else:
            display_values.append([row[0], row[1]])
    return display_values

styling = get_styling(data)
display_value = get_display_value(data)


value = {
    "data": data,
    "headers": headers,
    "metadata": {
        "styling": styling,
        "display_value": display_value,
    },
}

with gr.Blocks() as demo:
    gr.Dataframe(value, show_search="search")

demo.launch()
One thing to keep in mind is that the gradio DataFrame component only accepts custom styling objects when it is non-interactive (i.e. in "static" mode). If the DataFrame component is interactive, then the styling information is ignored and instead the raw table values are shown instead.
The DataFrame component is by default non-interactive, unless it is used as an input to an event. In which case, you can force the component to be non-interactive by setting the interactive prop like this:
c = gr.DataFrame(styler, interactive=False)This is just a taste of what's possible using the gradio.DataFrame component with the Styler class from pandas. Try it out and let us know what you think!